Buyers and sellers are back doing business but the outlook for the housing market hangs in the balance. Our House Price Index looks at the latest housing trends in May 2023 and why recent inflation figures might put a brake on market activity.
House prices fall 1.3% in last 6 months – but they’re no longer falling as quickly
UK house prices and activity in the housing market are continuing to adjust to higher mortgage rates and rising living costs.
Our UK House Price Index for May 2023 shows a 1.3% drop in house prices over the last 6 months.
More recently, house prices have been falling more slowly than they did at the end of 2022 as buyers have started to regain some confidence.
At the same time, the number of property sales in the UK has increased thanks to lower mortgage rates over recent months and the strong labour market.
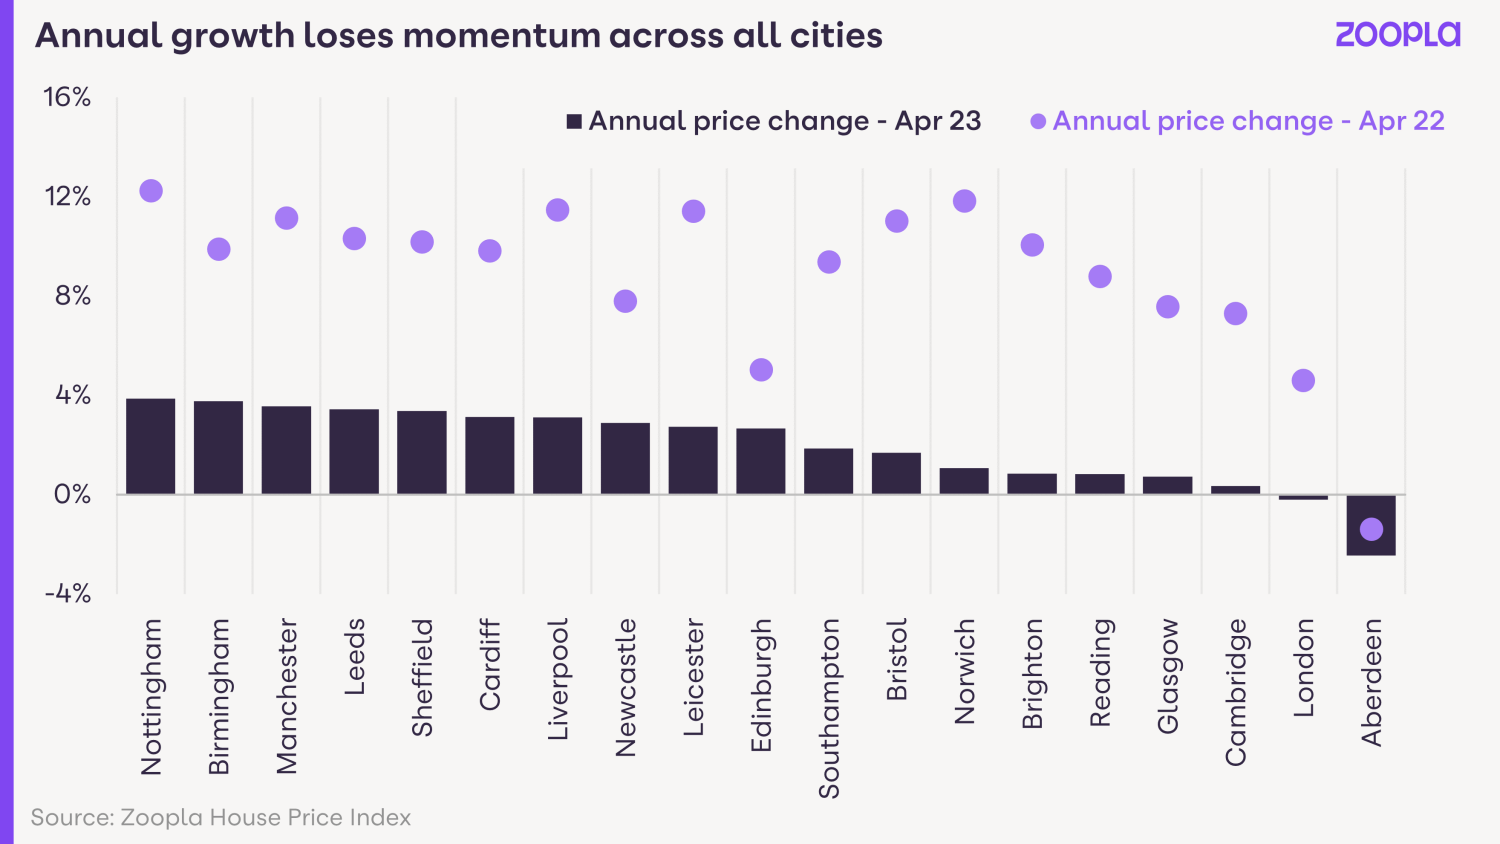
The annual rate of house price growth is 1.9% for the UK – down from 9.6% last year – ranging from -0.2% in London to 3.6% in Wales. We expect house prices to remain broadly the same for the rest of the year.
However, the latest inflation data is higher than expected. This increases the likelihood of a further Bank Rate rise.
This will have a knock-on effect on mortgage rates – which could now edge higher in the coming weeks.
This would reduce buying power for those using a mortgage and limit the ability of buyers to move, keeping house price growth very low in the second half of the year with the likelihood prices could drift lower.
Meanwhile, the number of property sales in 2023 is on track to be 20% lower than last year.
More homeowners put their house up for sale as market confidence improves
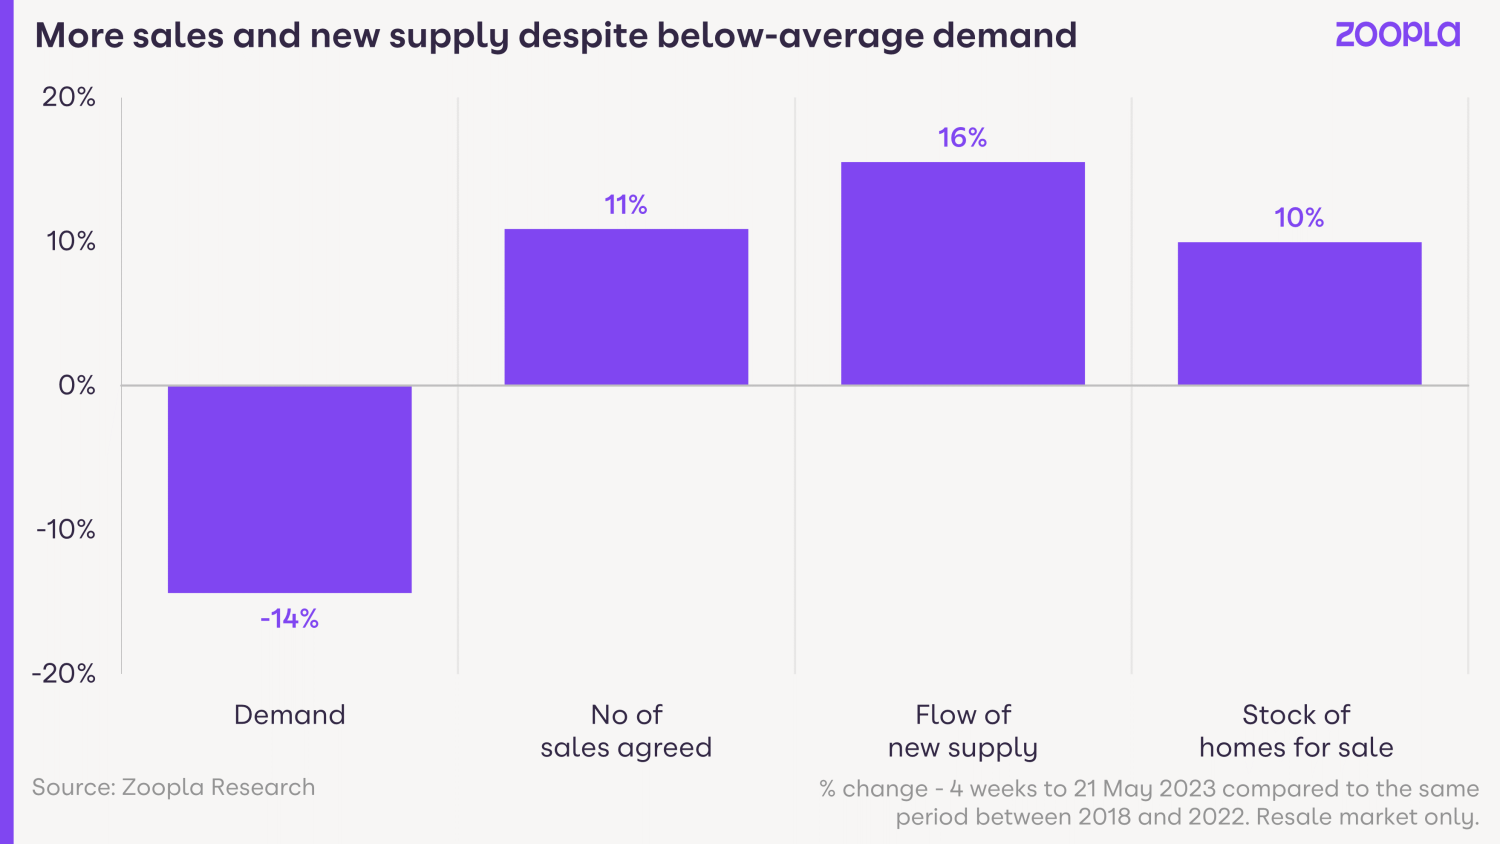
Our House Price Index for May 2023 shows that the number of new sales agreed in the last four weeks is 11% higher than the five-year average for the same period.
This is boosting the flow of homes for sale because many buyers are also selling their home at the same time. The flow of homes coming onto the market is up 16% on the 5-year average.
However, it’s vital that sellers remain realistic on pricing to attract buyer interest if they are serious about selling.
18% of homes currently for sale on Zoopla have had the asking price cut by 5% or more – but in February, this figure was 28%.
Price reductions typically come 8 weeks after the first listing as sellers try to boost interest from buyers.
More homes coming to market for buyers and discounts available
Landlord sales add to the supply of properties for sale
Some landlords are adding to supply levels by selling their properties to rationalise their portfolios and avoid the impact of higher mortgage rates.
Our Index shows that 1 in 10 (11%) of homes currently listed for sale were previously rented out. This figure peaked at 14% in 2020 during the pandemic and has gradually decreased since then.
Five years ago, around 50% of these rental properties listed for sale returned to the rental market – either unsold or bought by another investor. However, only a third are returning to the rental market more recently.
These ex-rented properties are 25% cheaper in asking price than owned homes (£190,000 vs £250,000). They are appealing to first-time buyers, particularly in light of tougher buying conditions this year.
Housing market conditions vary across the country in May 2023
Our House Price Index tracks sold house prices across the country and it shows that the housing market looks very different across Great Britain.
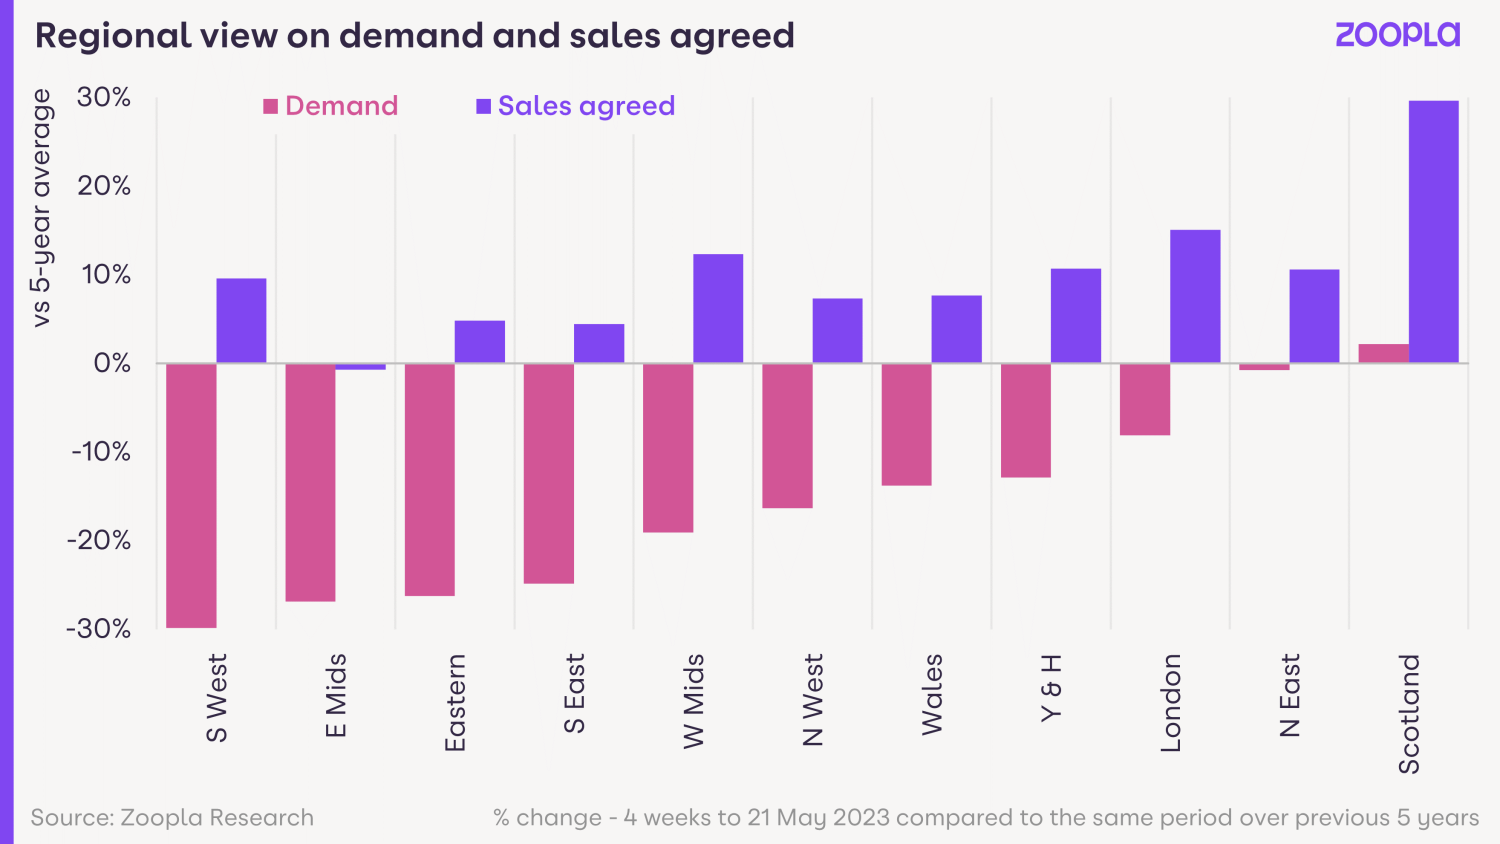
Scotland, the North East and London continue to have the highest buyer demand and 10% more agreed sales than the national average.
In the Midlands, South East, South West and East of England on the other hand, buyer demand remains below average. These are areas where house prices rose the most over the last 3 years.
Together with higher mortgage rates and the cost of living, fewer buyers can afford the boosted house prices in these areas.
However, there are still more sales than average across the Midlands and the South of England, showing a good number of active buyers in the market to move.
No build-up in unsold houses sitting on the market
While demand is weaker and supply is rising, there’s no backlog of unsold houses sitting on the market.
The number of homes listed for more than 90 days is in line with the 5-year average in most areas.
New sellers need to set their asking price carefully, but there are no large house price falls looming to clear housing stock at this stage.
House prices hold steady for sellers
Buyer demand is weaker where house prices have risen faster than earnings
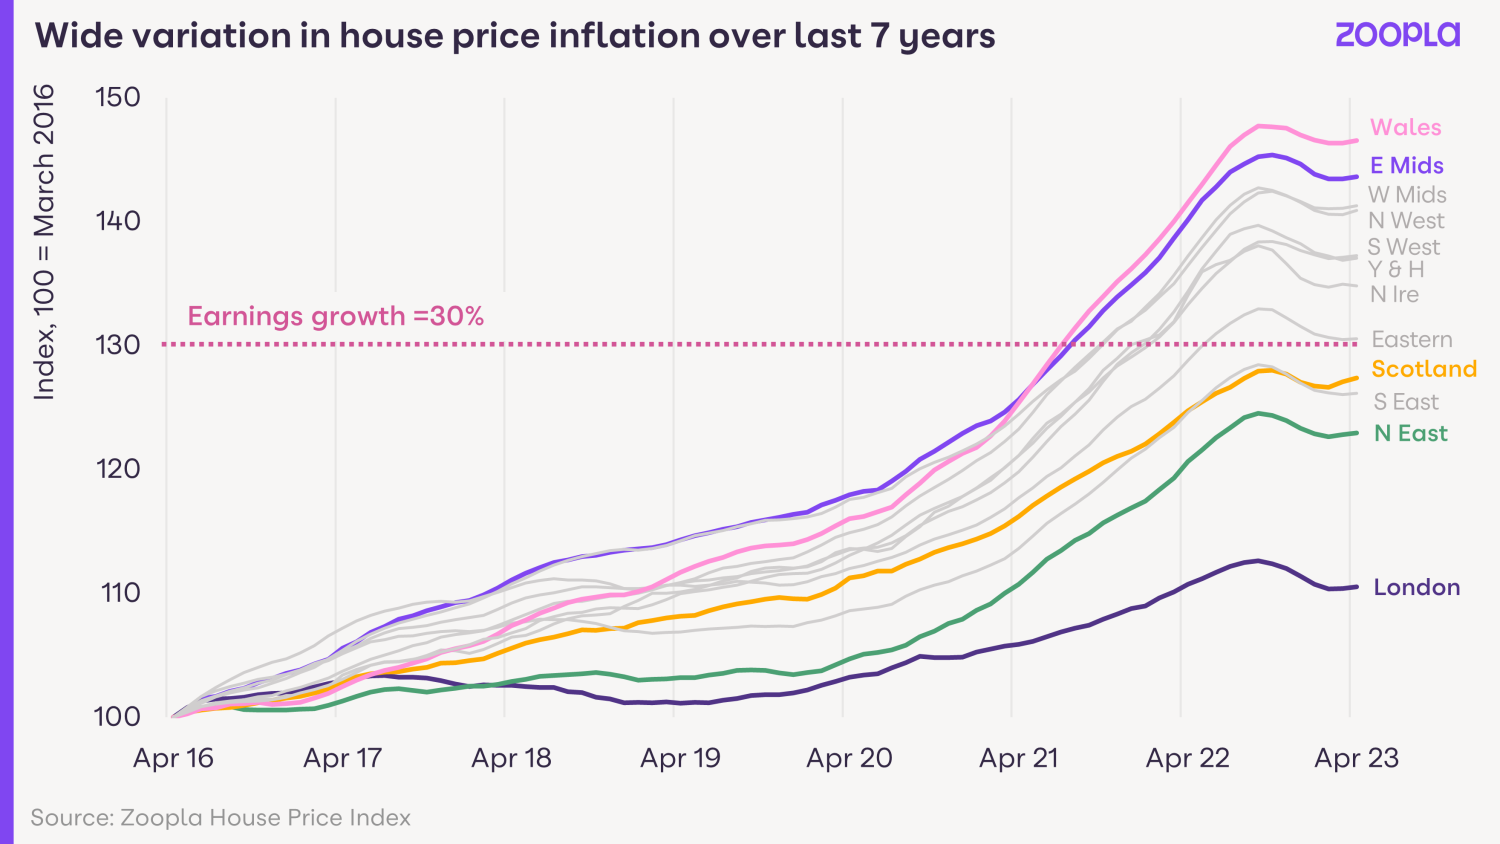
The difference in regional housing markets can be explained by how much house price growth each region has seen in the last 7 years.
Above-average house price growth has made some areas unaffordable and increased the sensitivity of would-be home buyers to higher mortgage rates.
House price growth over the last 7 years has ranged from 12% in London to 47% in Wales. During that time, average earnings increased 30% in the UK.
So those areas like Wales – where house price growth has considerably outpaced earnings – are where buyer demand is below average at present.
In contrast, the regions and countries with the lowest rate of house price growth since 2016 are seeing more activity from buyers and sellers.
In London, house prices are twice the UK average – but below-average house price growth over the last 7 years means affordability has improved.
The capital is still expensive but offers better value for would-be buyers, especially for flats which are unchanged in average value since 2016.
What’s more, higher migration into the UK is likely to be supporting above-average activity in London’s housing market.
Has the housing market avoided a house price crash?
A big increase in the cost of mortgage borrowing would historically precede a fall in house prices.
But the impact of higher mortgage rates is less pronounced than in the past. This is thanks to mortgage regulations introduced by the Bank of England in 2015.
Anyone taking a mortgage since then has had to prove to their bank that they could afford a 6.5-7% rate, even if they were paying a 1-2% rate.
It’s as if the housing market has been operating at 6-7% mortgage rates already. This is a key reason we’ve seen only a small impact on house prices so far.
Now, most banks are testing buyers’ affordability for 8% mortgage rates or higher, which has limited demand and sale numbers in 2023.
What will it mean for the housing market if mortgage rates edge higher from May 2023?
The increase in UK housing market activity this year is down to average mortgage rates falling back towards 4%, in line with the underlying cost of fixed-rate finance to banks.
However, this underlying cost jumped at the end of May, which implies that we could see an increase in mortgage rates in the near term.
This trend has been building during May as concerns over inflation have risen.
The robust housing market activity in the last 2 months indicates that 4-4.5% mortgage rates are generally manageable for home buyers – despite this being double the rates of late 2021. But higher living costs are also eroding spending power.
With mortgage rates of 4-5%, we expect our Index to show annual UK house price growth of +2% to -2% and circa 1 million sales a year, as long as the labour market remains strong.
The more mortgage rates move above 5%, the greater the impact on people’s ability to get a mortgage and buy a home, and the greater likelihood that UK house prices will start to fall.
Banks have mortgage funding at the current rates for the next few months from May, so rates should not jump immediately – although they are starting to increase rates on their best deals.
Much depends on financial markets and their assessment of the outlook for short-term interest rates.
Overall, it seems likely that the housing market momentum of spring 2023 will weaken in the second half of the year, with the impact depending on the outlook for mortgage rates. But falling energy bills and rising earnings continue to support buying power and offset the impact of higher mortgage rates.
To read the original article click here


